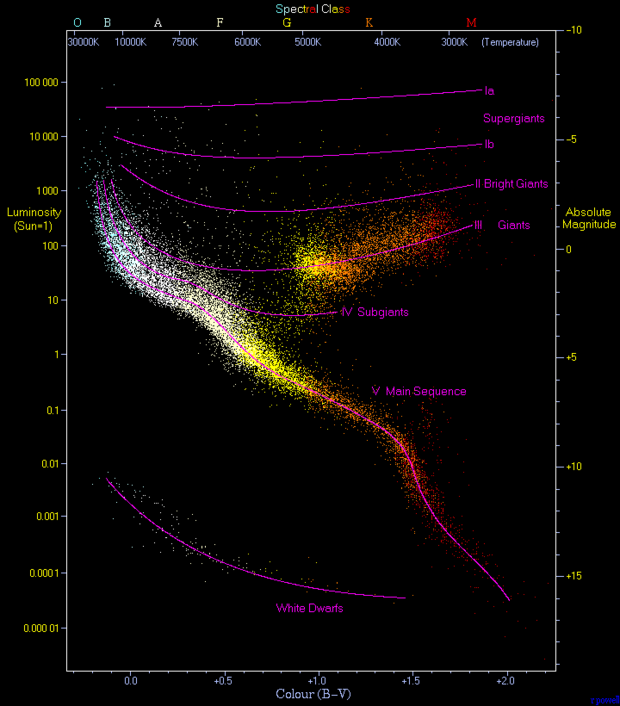
This data visualization shows a scatter plot of about 23,000 stars gathered from the Hipparcos and Gliese catalogs, populated with a list of stars from astrological surveys. The graph above displays these stars on a scatter plot that compares their color (surface temperature) to the luminosity (energy emitted per second). Opposite to these measurements appear spectral class and absolute magnitude scales which are proportional and other key measurements astronomers use to compare stars. To someone with deep astronomical knowledge, I think this visualization still displays a clear pattern among star types. The longest fitted curve corresponds to the main sequence, where the highest concentration of data, which stars tend to move upwards then branch off to one of the “giant” curves then sometimes burn up and fall back to the dwarf curve. Together, this is supposed to convey how the mentioned characteristics of stars relate to and describe the process of stellar evolution.
The graph succeeds as a data visualization tool because it combines color-coding (blue to red reflecting the actual observable colors) with a vertical luminosity scale. The axes make it easier for viewers to see correlations. The labeled purple curves aren’t visually conflicting and reinforce the idea that different parts of the plot correspond to different stellar categories. For novice astronomers (the likely intended audience), this helps convince them that there are strong relationships between the temperature and brightness of stars. The style suits the data because it is simple but also visually engaging. Without the visualization, a paper describing this phenomenon would be much less understandable and would likely leave most people confused about the correlations.
This graph is often referred to as a “Hertzsprung–Russell Diagram” and is the main image on its Wikipedia page. I wasn’t able to find the exact source of this graph various types of these graphs are usually found in articles from physics journals and university lecture slides. The original data sets come from the European Space Agency’s Hipparcos mission and the Gliese catalog of nearby stars. These sets are likely stored in plain-text or CSV formats and can be accessed through astronomical databases like SIMBAD and the Digitized Sky Survey (DSS).