Annotated Bibliography

Branscombe, Mary. “When Is Data Too Clean to Be Useful for Enterprise AI? | CIO.” Accessed February 18, 2025. https://www.cio.com/article/3611247/when-is-data-too-clean-to-be-useful-for-enterprise-ai.html.

  • This article explains why AI tools need access to rich and substantial data sets rather than ultra-refined ones. This article is relevant to the new AI boom and how data cleaning can negatively affect its development if certain measures aren’t considered.

Foote, Keith D. “The Impact of Poor Data Quality (and How to Fix It).” DATAVERSITY, March 1, 2024. https://www.dataversity.net/the-impact-of-poor-data-quality-and-how-to-fix-it/.

  • This articles presents the needs for high quality data in the business world and defines this data and how to collect it. I would like to explore how unrelated industries might be making decisions based on high quality data or how a lack of it could contribute to failures.

Gilbert, David. “Google, Microsoft, and Perplexity Are Promoting Scientific Racism in Search Results.” Wired. Accessed February 18, 2025. https://www.wired.com/story/google-microsoft-perplexity-scientific-racism-search-results-ai/.

  • This article highlights a realized danger of providing AI with data that is false yet prevalent, it adapts to what it is given without considering the results. I would love to learn how companies have approached this issue and want to learn more about the spread of misinformation due to bad data.

Hosseinzadeh, Mehdi & Azhir, Elham & Ahmed, Omed & Ghafour, Marwan & Ahmed, Sarkar & Rahmani, Amir & Vo, Bay. (2021). Data cleansing mechanisms and approaches for big data analytics: a systematic study. Journal of Ambient Intelligence and Humanized Computing. 14. 1-13. 10.1007/s12652-021-03590-2.  https://www.researchgate.net/publication/356292133_Data_cleansing_mechanisms_and_approaches_for_big_data_analytics_a_systematic_study.

  • Comprehensive review of state-of-the-art mechanisms for big data analytics that highlights repairing and analyzing uncertainty within data sets. I want to cover the the main ways companies with massive data flux handle their data.

Moss, Aaron. “Too Important to Get It Wrong: The Consequences and Embarrassment of Bad Data Quality.” CloudResearch, September 15, 2022. https://www.cloudresearch.com/resources/blog/the-consequences-of-bad-data-quality/.

  • Highlights issues with the CDC’s initial response to the COVID19 outbreak and how their bad data influenced poor decisions. I don’t know if I will find much value in this article, I might have to branch upstream using some of its embedded links.

Rahm, Erhard & Do, Hong. (2000). Data Cleaning: Problems and Current Approaches. IEEE Data Eng. Bull.. 23. 3-13.

  • Describes data cleaning with very diverse data sets and how there needs to be justification for making changes to data. Another great source of data cleaning techniques and most specific journal article I have found.

Van den Broeck, Jan, Solveig Argeseanu Cunningham, Roger Eeckels, and Kobus Herbst. “Data Cleaning: Detecting, Diagnosing, and Editing Data Abnormalities.” PLoS Medicine 2, no. 10 (October 2005): e267. https://doi.org/10.1371/journal.pmed.0020267.

  • Describes the process it takes to clean data in the modern age along with a nice view of the historical context needed to understand where it originates. In depth resource that provides better context when reading about less scholarly resources.
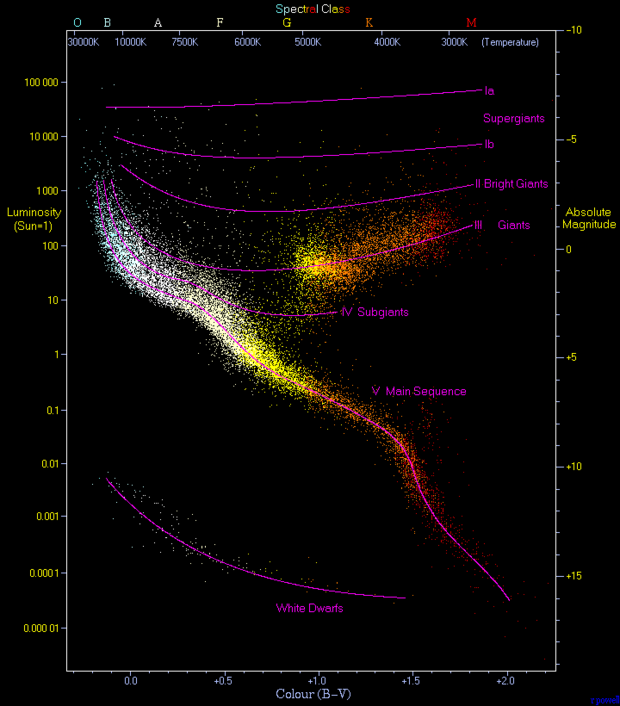
A Look Into The Stars

This data visualization shows a scatter plot of about 23,000 stars gathered from the Hipparcos and Gliese catalogs, populated with a list of stars from astrological surveys. The graph above displays these stars on a scatter plot that compares their color (surface temperature) to the luminosity (energy emitted per second). Opposite to these measurements appear spectral class and absolute magnitude scales which are proportional and other key measurements astronomers use to compare stars.  To someone with deep astronomical knowledge, I think this visualization still displays a clear pattern among star types. The longest fitted curve corresponds to the main sequence, where the highest concentration of data, which stars tend to move upwards then branch off to one of the “giant” curves then sometimes burn up and fall back to the dwarf curve. Together, this is supposed to convey how the mentioned characteristics of stars relate to and describe the process of stellar evolution.

The graph succeeds as a data visualization tool because it combines color-coding (blue to red reflecting the actual observable colors) with a vertical luminosity scale. The axes make it easier for viewers to see correlations. The labeled purple curves aren’t visually conflicting and reinforce the idea that different parts of the plot correspond to different stellar categories. For novice astronomers (the likely intended audience), this helps convince them that there are strong relationships between the temperature and brightness of stars. The style suits the data because it is simple but also visually engaging. Without the visualization, a paper describing this phenomenon would be much less understandable and would likely leave most people confused about the correlations.

This graph is often referred to as a  “Hertzsprung–Russell Diagram” and is the main image on its Wikipedia page. I wasn’t able to find the exact source of this graph various types of these graphs are usually found in articles from physics journals and university lecture slides. The original data sets come from the European Space Agency’s Hipparcos mission and the Gliese catalog of nearby stars. These sets are likely stored in plain-text or CSV formats and can be accessed through astronomical databases like SIMBAD and the Digitized Sky Survey (DSS).

Searching for Clothing with AI

If I created an AI app, I would develop an algorithm that helps people find and buy clothes for their wardrobe. While this idea is probably less “impactful” on the world than some other ideas out there, it could help more people dress the way they want within their budget range. To begin using it, users would have the option of documenting their current wardrobes and how much they wear specific items for the algorithm to start at a baseline. If the user does not want to use this feature they can always supply more keywords and themes for the app to work with.  Additionally, users would be able to specify their needs in a new wardrobe. For example, the algorithm would know to consider whether the user plans to wear clothes for comfort or style and what type of climate they usually dress for along with numerous other options that could help the algorithm curate a more individualized clothing selection. Theoretically, the more specific inputs the user gives the algorithm, the better equipped this app will be to provide the right choice of styles and items the user is looking for.

Once a user prompts the AI to provide a clothing selection depending on their preferences, the app will generate a short list of possible styles and pieces that align with their needs. The AI will use data scraped from clothing websites online and use data from reviews online to point customers to local shops as well. If the user is not content with the initial results, they can further tailor their queries to hopefully meet their desires. In terms of revenue, this app will take minor fees associated with online purchases made through the help of the app and possibly will have to rely on some ad revenue to maintain it. To avoid harm, we will never require a user to submit personal information and if they choose to, it will remain confidential. Additionally, to avoid bias we will have a strict policy for collecting data that our algorithm runs on to best support the wide array of clothiers the app points customers to.

Brainstorming a Project Topic

For my project topic, I want to focus on a topic related to data science. Specifically, I find issues related to collecting, cleaning, and archiving data to be the most interesting consequences of the age of big data. With the incomprehensible amount of data being introduced into our networks at any given second, I want to know how humans are attacking these problems and what technologies are being leveraged. We need new ways to extract insight from datasets that highlight the relevant content.

As a physics and math major, I enjoy thinking analytically and find modern data problems extremely interesting. Quality data plays a crucial role not only in business and technology but also in scientific research, which I am more familiar with. This past summer, I worked on a research project that focused on improving an algorithm for gravitational wave source detection. It was fascinating to learn how current state-of-the-art facilities like LIGO wrestle with a constant stream of data coming from space and can extract valuable results from the weak but elaborate signals of black hole and binary star mergers. My research team’s goal for the code was to improve its ability to sort through detector data so that gravitational wave signals could be isolated to a higher standard. This research experience made it clear that math supplies the theoretical foundation for organizing and analyzing data, while physics offers real-world applications that demand precision and accuracy of results.

I am not quite sure what to focus on regarding a specific topic related to data cleansing and organization. This area of data science is extremely relevant to what we have previously discussed about data archiving and AI emergence. There are many branches to explore, but I am leaning toward a more technical exploration of a related subject. For now, I will continue to brainstorm.